
The presented data visualisation about topics and question types is updating online as every new IELTS question is added to our database. As all questions are not official (they are reported by exam-takers and gathered from the internet), the statistics based on them could represent an incomplete view; however, due to the huge number of samples, the resulting error is likely minimal, and we can assume the overall picture is accurate.
Let's start with the analysis of topic distribution for the whole exam — both, speaking and writing tasks:
Overall IELTS topic statistics
The pie chart above illustrates real-time cumulative data about IELTS question topics from both parts of the exam: Speaking and Writing. Overall, the exam themes are nicely diversified — there is no dominant theme.
You will notice 7 main topics with around 10% each and three of them could be considered the core themes of IELTS — Education, Entertainment, and Places. With Work and Health and Diet, they hold half of the pie. It simply means there is a 50% probability that you will meet one of these topics in your IELTS exam.
With about 10% each, Storytelling and Life are special task categories, and, in fact, might be about any topic that is not included in other sections. The only difference is that Storytelling includes tasks where you should tell a story (Speaking part 2 or Writing part 1 Letter), rather than describe something or share an opinion.
Nevertheless, if you take a look at particular parts of the IELTS test, you'll see that they are not as consistent:
IELTS subpart topic statistics
IELTS Letter (Writing Task 1) topic data
While there are no favorites in themes for the exam overall, two topics reign supreme in IELTS Letter tasks: Work and Places, with impressive percentages of about 30% each. At a frequency of less than half of these major themes, we find Education and Storytelling, which hold second place. Among other topics, letters about Entertainment (only in an informal-letter task) are most common but it is still less than 10%.IELTS Essay (Writing Task 2) topic data
The three kings of IELTS essays are: Education (20-odd percent), Work (10-15%), and Media and Technology (10-15%). They make up about 50% of all IELTS essays. Health and Diet and Environment follow them, with about a 10% chance to meet them in a task.IELTS Speaking topic data
As to IELTS Speaking, it is pretty representative and includes all topics. Two themes that lead slightly are Entertainment and Places, with an average probability between 10% and 15%.Okay, now let's look at writing task type distribution:
IELTS Writing Question Types
IELTS Letters (Writing Task 1) question type data
When it comes to IELTS letters, nearly half of all tasks are of the Giving Information type. In the middle, Request and Complain have about 20% probability each, which means two of five random letter tasks will be from these categories. With a paltry 5% each, four other types — Apology, Invitation, Thanking, and Applying for a Job — win the third place.
IELTS Essays (Writing Task2) question type data
IELTS essay type distribution is more smooth; however, the major type — Argument Essay — also keeps a hefty number (roughly 50%) of all Writing Task 2 questions. The second most frequent type, Opinion Essay, is half as common. The Two-question Essay type represents about 15% of the pie. Finally, 1-in-10 essays are the Problem-and-Solution Essay, which is the rarest type, but it is still significant enough to practice.
- Start your preparation with Education, Work, Entertainment and Places topics.
- Master Giving info, Request and Complaint letter types and Argument and Opinion essay types first.
Test Type Statistics: Academic IELTS vs General IELTS
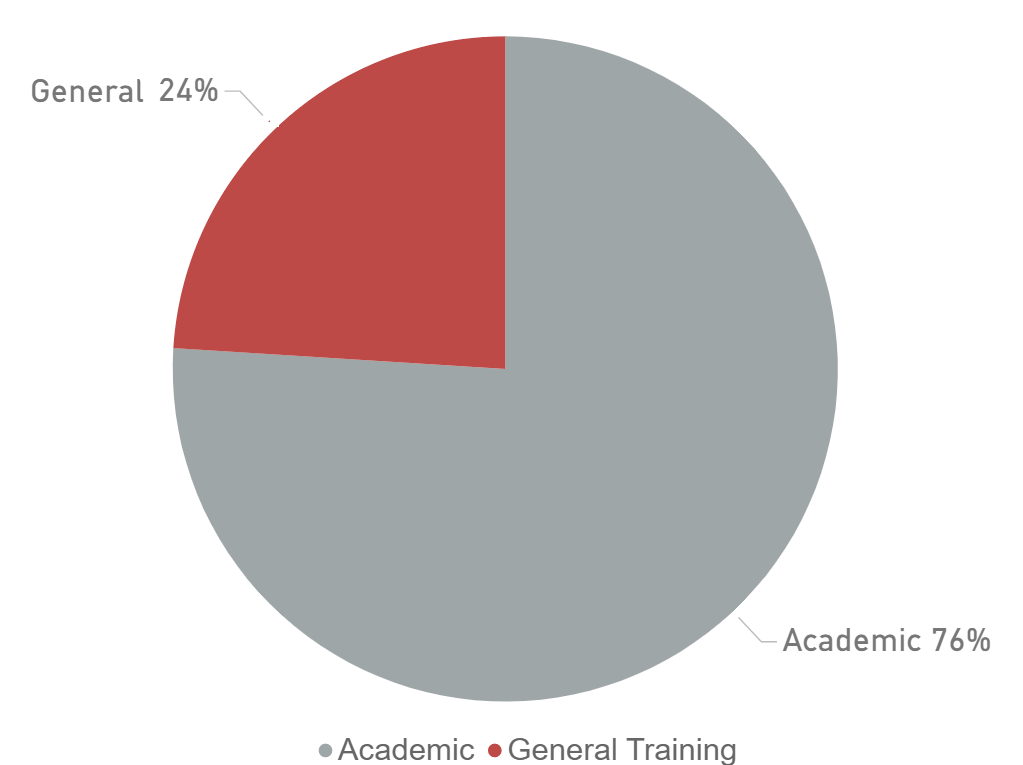
Unsurprisingly, in terms of the exam type popularity, Academic IELTS, without a doubt, is the leader — three-fourths of all IELTS-takers go for the Academic type of the exam. General IELTS has the remaining 25%. It is not some shocking fact, because there are more test takers who take the exam for an application to a school or university than for other purposes.
Motivation statistics: reasons for taking IELTS
Charts below were calculated by IELTS officials and published on ielts.org.
There is something interesting in the charts below: the IELTS band distributions for different brackets based on the purpose for taking the test. The purposes are declared by test takers themselves (in a questionnaire that you fill while registering for the exam).
Academic IELTS takers' scores

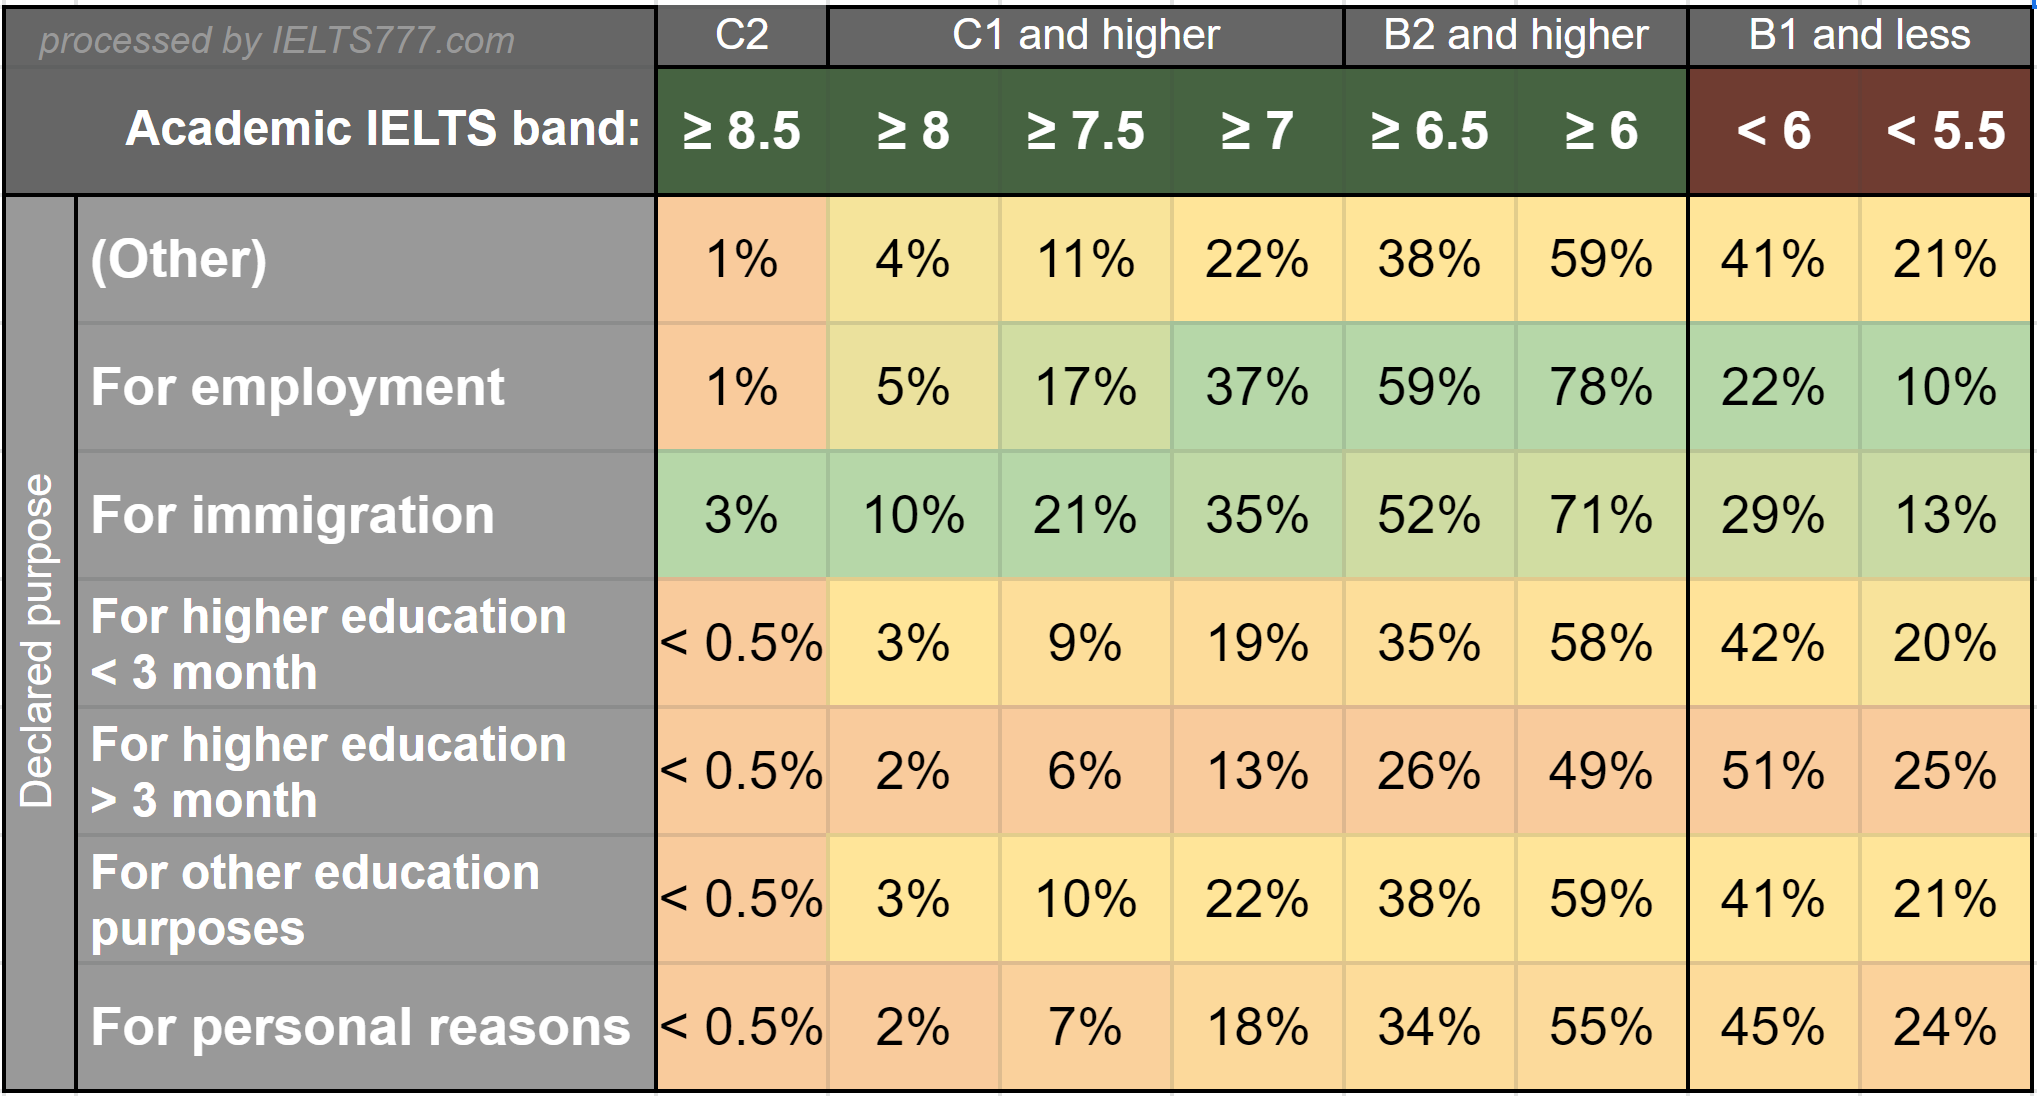
First of all, people who declared immigration or employment as a purpose have the best score distributions for this type of exam. However, the number of people in these groups should be comparably low, as it is super rare to use the Academic IELTS for a job or immigration application. Meanwhile, IELTS candidates doing the test for educational goals (the most significant group in Academic exam test-takers) have markedly lower scores.
The cut-off IELTS bands for bachelor and master admissions usually lie in a range of 6 to7.5. The graph shows that only half of candidates got the six-and-higher score and about one-fourth had less than 5.5. (It is perhaps also important to remember that when applying for international studies, you may also need a certain IELTS score for your visa, too.)
General IELTS takers' scores
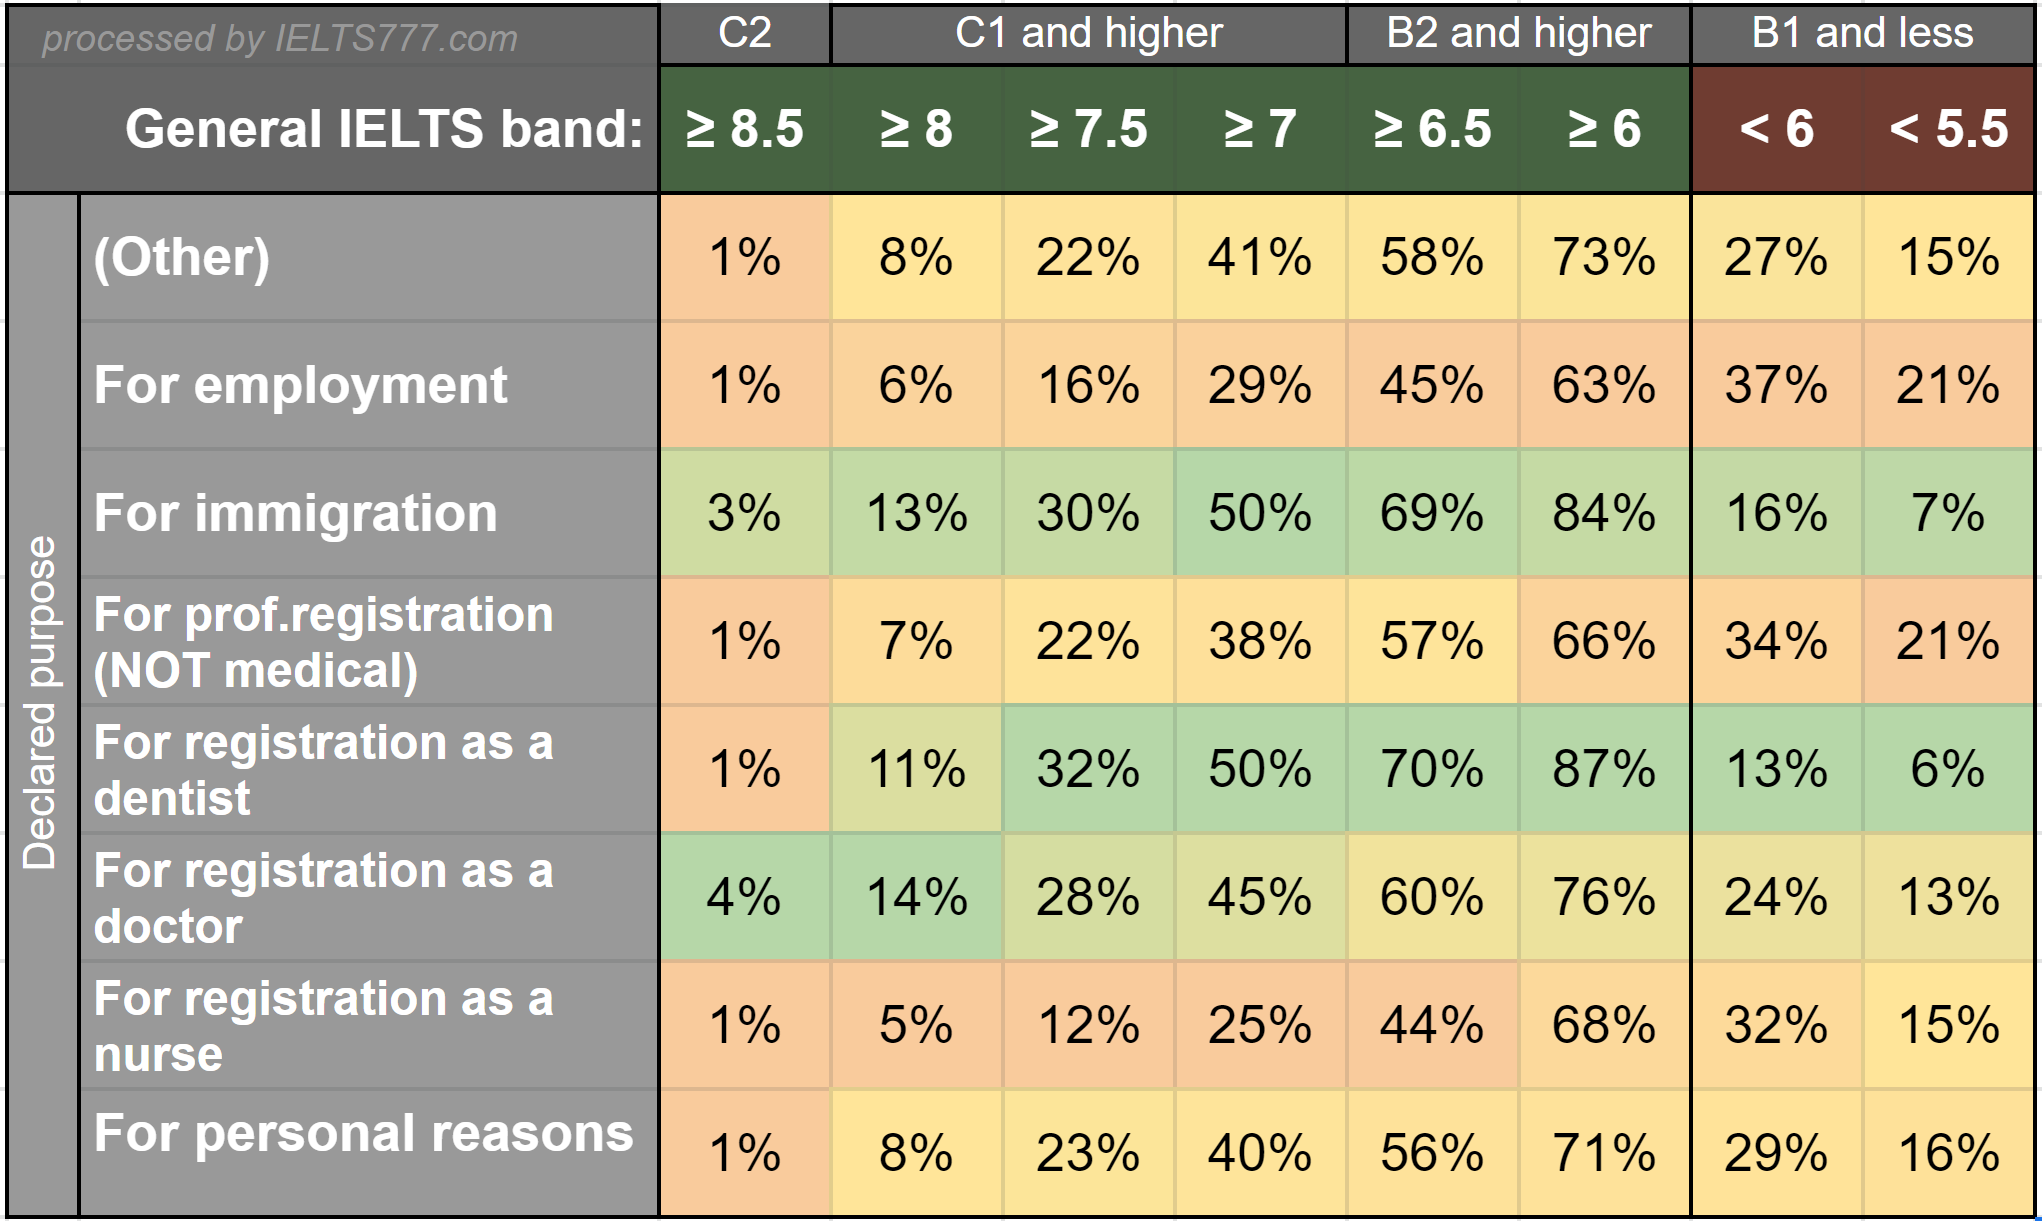
What is markedly noticeable is that General scores are, on average, stronger, and future immigrants and doctors (but not nurses!) perform the best. More than four-fifths of them have a band higher than 6.
Overall, the main facts are:
- Academic IELTS is a bit more difficult — General IELTS band distributions are shifted by nearly 0.5 points towards the higher scores, compared to Academic IELTS.
- Do not even think you receive band 9 in IELTS — statistics says this mission is almost impossible.
- If you want to get a higher band score, become a dentist and decide to immigrate! — We can safely assume from this analysis that people who decided to immigrate or want to work as doctors in English-speaking countries are the most motivated candidates and this leads to higher IELTS results.
Congratulations! Now, after reading these insights, IELTS has become clearer for you, and we hope you will use this information to enhance your effectiveness in IELTS preparation with ielts777.com.